Rightmove’s House Price Index at February 2018 has just been published and here are the headlines.Record home-hunter activity fuels rises in most regions
Demand for housing remains resilient, with an active start to 2018. Indeed, the number of monthly visits to Rightmove in January is at its highest ever level, at over 141 million. This has helped to fuel a degree of cautious optimism among new-to-the-market sellers in most regions of the UK, with average asking prices up by 0.8% (+£2,414) this month.
Miles Shipside, Rightmove director and housing market analyst comments: “Whilst it is the norm for new sellers’ asking prices to be buoyant at the start of a new year, this first complete month in 2018 is seeing more pricing optimism than the comparable period in 2017. The political and economic uncertainty is out of sellers’ control, but they are in control of their asking prices, and in general they are not being overly ambitious or setting too high an asking price. This month’s rise of 0.8% is well below the 1.6% monthly average at this time of year over the last ten years, and it is wise for sellers to be cautious and not to over price given stretched buyer affordability.”
All regions but one have seen the price of newly-marketed property increase this month, with the South West being a very marginal exception with a fall of just £131. However, the annual rate of increase remains subdued at just 1.5%, dragged down to a degree by London’s year-on-year fall of -1.0%. But despite buyers’ price-sensitivity, home-hunter visits to Rightmove have hit a record high.
Shipside adds: “Rightmove is a great barometer of housing demand, and January was its busiest month ever with home-hunters spending over 1.1 billion minutes on the site. Encouragingly for buyers, there are more fresh properties for sale to look at too. With not enough supply of new-build properties, the market needs more churn from existing owners to get the healthy balance of buyer momentum without unhealthy property scarcity and consequently higher prices. Nationally, 2% more sellers have come to market this month compared to the same period a year ago, which is a small step in the right direction. However, with a myriad of local markets with different supply and demand dynamics, those contemplating a move should monitor their area and use the expertise of local agents with their fingers on the pulse.”
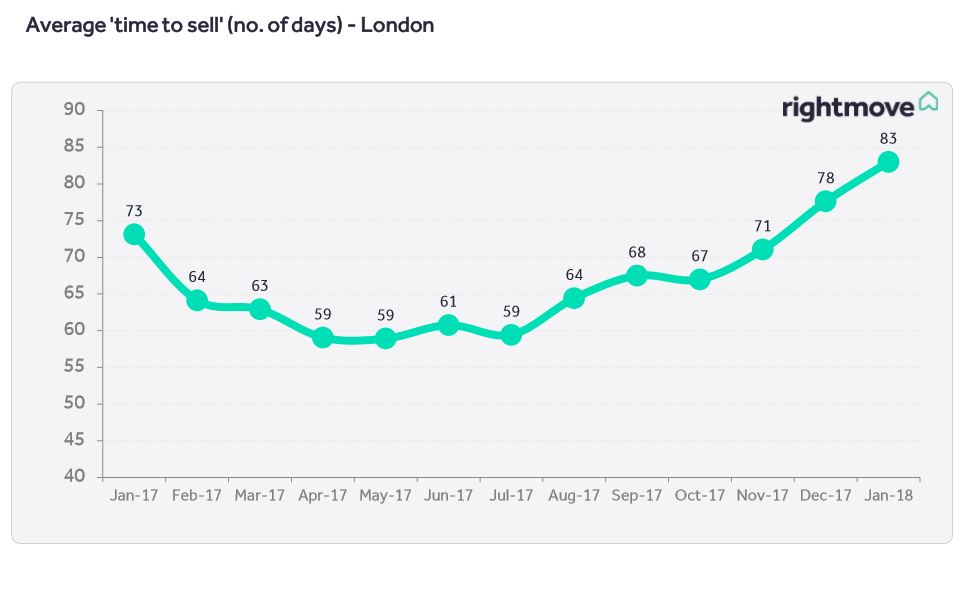
There are signs that the increased home-hunter activity is fuelling a recovery in the number of sales agreed, which in Q4 of 2017 were running at an average drop of -5.5% compared to the prior year. Taking the first full month of 2018 as a snapshot, sales agreed numbers in January have now recovered to -1.6% down compared to a year ago. Again there are marked local market differences, but Rightmove analysis of properties that have been newly listed since October 2017 and have been marked as sale agreed reveals that six out of the top ten fastest selling locations are in either the East or West Midlands. However, top of the quick-to-sell league is Livingston in Scotland, selling at an average of only 17 days, for those properties that have been newly listed since October 2017 and have sold.
Shipside observes: “The average price of newly-marketed property in the Midlands is up by over 5% compared to a year ago, a marked contrast to parts of London and its commuter belt . Many buyers in the Midlands are willing and able to pay more to secure their future home in a faster – selling market, resulting in Midlands prices rising three times faster than the national average . Much of the UK still has momentum, with good buyer demand for the right property at the right price, and the recovery in the number of sales agreed is another indicator of pent-up demand keeping the market moving.”
Estate agents’ Views
Halinka Connelly, Branch Manager at Dixons in Bromsgrove, says: “January brought with it a real surge of activity and every property that came to the market at the beginning of the year is now sold, under offer or seeing very good volumes of viewings. Traditionally, January is a busy time in the annual property cycle but this doesn’t necessarily mean a high level of sales. However, in January 2018 all our properties have so far sold for asking price, or over, highlighting the strength of the market in Bromsgrove. Having experienced such a busy January we’re now looking for more properties to introduce to our buyers.”
David Plumtree, Connells Group Estate Agency Chief Executive, says: “With our branches reporting brisk activity from the 2nd January, we have seen new instructions, applicant registrations and viewing activity all exceed the levels achieved in January 2017. Within this, first-time buyers are continuing the trend that we’ve seen since the announcement of the stamp duty changes, with registrations up 11% on January 2017. Sales are yet to see the full benefit of the increase in activity, however, with the confidence levels exhibited by both vendors and prospective purchasers moving ahead of those seen during the latter part of 2017, we do expect market conditions to show continued improvement during the first quarter.”
Kevin Shaw, national sales director at estate agency Leaders, says: “January saw a significant increase in new listings, applicant numbers and viewings compared with the start of 2017. This uplift in activity is a positive indicator for the year ahead, however the market is still price-sensitive and sellers should be aware that setting a realistic price based on local market conditions remains key to achieving a sale. We are certainly seeing greater market buoyancy in the Midlands, with average prices up around 5% compared with last year. Derby, Mansfield, Loughborough and Kings Norton are notable hotspots at the moment, with homes in these areas selling quickly, often at full asking price.”
Fewer inner-city sellers coming to market helps boost prices
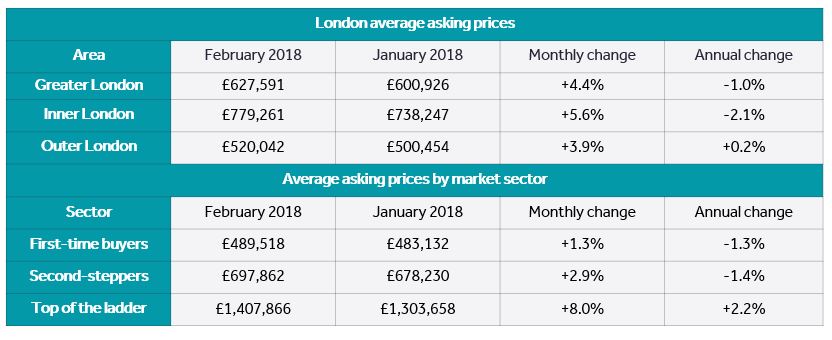
- Usual New Year price jump with average price of newly-marketed property in the capital up by 4.4% (+£26,665) this month
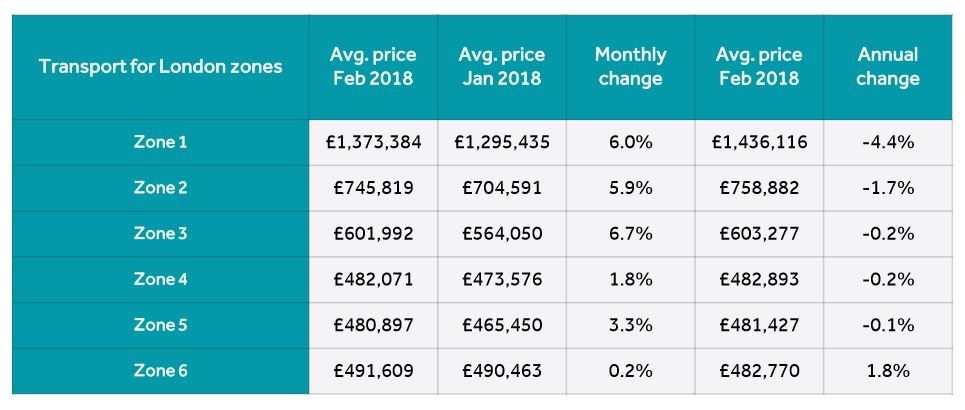
- This rise is largely driven by scarcity of new sellers in Zones 1 to 3, with new listings down 4% on previous year, leading to a 6.2% monthly increase in average prices
- In contrast, Zones 4 to 6 see 3% more new-to-the-market sellers compared to this time a year ago, with extra supply resulting in a more muted monthly price rise of 1.8%
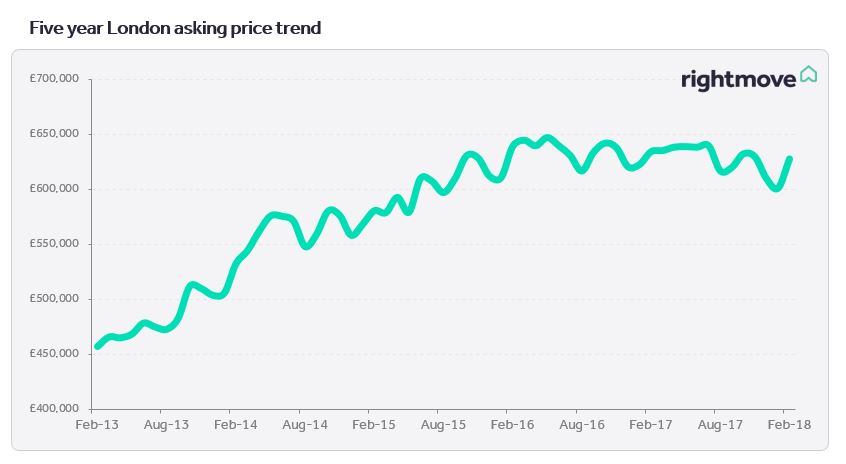
- Overall price drop of -1.0% shows London still in period of adjustment
Overview
The price of newly-marketed property in London sees the usual New Year price jump, with more expensive properties boosting the average price to a 4.4% (+£26,665) rise this month. This is particularly marked in the typically more expensive Zone 1 to 3 areas closer to the centre of the capital, where the average price of property coming to market has jumped by 6.2%. Fewer owners in these Zones are putting their property up for sale, helping to reduce supply and underpin seller pricing power.
Miles Shipside, Rightmove director and housing market analyst comments: “End of the boom prices normally re-adjust more quickly if there is an over-supply of sellers trying to exit their property investments. However, the lack of new listings in the typically pricier more central locations indicates that some would-be sellers are holding back, preventing a glut of competition from forcing prices downwards. Cash-rich owners are showing that they are able to sit tight instead of coming to market now, and await their hoped-for price recovery.”
There are 4% fewer properties coming to market in Zones 1 to 3 compared to this time a year ago, with the greatest shortage of new listings in Hackney (-22%). In contrast Zones 4 to 6 have seen 3% more property come to market, and in spite of the usual seasonal boost have seen more conservative average monthly price rises of 1.8%.
Shipside adds: “London is a myriad of different markets, under-pinned by a historical shortage of affordable supply. Rapid price rises in recent years have resulted as usual in a re-adjusting market, with overall year-on-year price falls in new seller asking prices of 1%. If fewer sellers come to market then competition and downward price pressure will be less. However, unless you have an extra-special property you may have to sacrifice some of the substantial price gains of the last few years to attract more buyer interest and effect a speedier sale.”
Transport for London zones
You can see the full report, covering London and regional trends, here.
If you would like an up to date valuation, please don't hesitate to get in touch with our team. I Am the Agent, one of the UK's first online estate agents, has sold and let over 10,000 properties online. You can sell your property online for as little as £399 inc VAT, and that includes free pro photos or a free EPC. Talk to a member of our team on 0333 444 1007. Check out our sales properties too.
Report and images courtesy @Rightmove